Dynamic State and Trace
Two tools help you understand why a command did what it did: Dynamic State, which shows what
changed in the game world, and Trace, which shows which rules fired. Both need the dgdebug
engine, and neither is available for a command that ends on a single-keystroke prompt — the
debugger cannot be interrupted mid-keystroke to gather the information.
Dynamic State
Dynamic State answers the question "what changed in the world as a result of this command?".
Turn it on with the Dynamic State toggle in the navbar. It is a display toggle only — the
information is captured after every command regardless — and it is disabled for the frotz engines.
With it on, each transcript knot gains a row of chips after its response:
-
a green chip,
+name, for a flag or variable that became true or came into existence; -
a yellow chip,
-name, for one that became false or went away; -
a blue chip,
name = value, for a variable whose value changed.
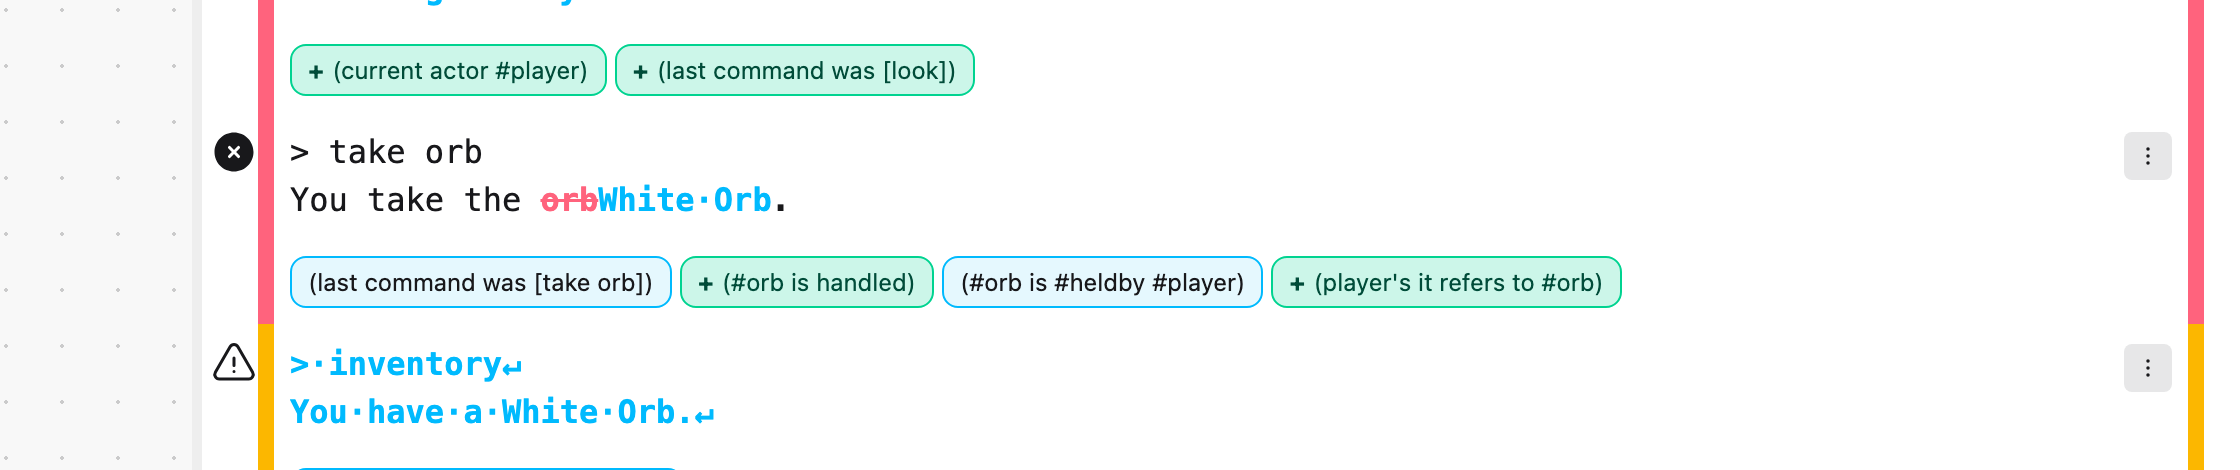
The comparison is against the nearest ancestor knot that has a captured snapshot — usually the parent, but not always. A freshly loaded skein, or a knot reached through a keystroke prompt, has no snapshot of its own, so the diff reaches further up the tree to find one.
Where the information comes from
After each command the extension runs dgdebug’s `@dynamic query and parses its four sections:
global flags, per-object flags, global variables, and per-object variables. The (has parent $)
and (has relation $) predicates are combined into a single synthesised location predicate,
($ is $ $), per object, so an object moving from one place to another reads as one change rather
than two.
These snapshots live only in the running session. They are never written to the .skein file, but
they do travel with undo and redo, since re-running a command is itself an undoable edit.
Trace
Trace answers "which predicates were tried for this command, in what order, and where is each one defined?".
Open it from a knot’s "…" menu → Trace, or with Option+T / Alt+T. On the root knot, Trace instead traces the project’s startup. The Trace panel opens in the panel area, alongside Terminal, Output, and Debug Console, and reveals itself automatically when you request a trace. Tracing does not move the active knot and never changes the skein — the trace is regenerated from scratch each time you ask for one.
Reading a trace
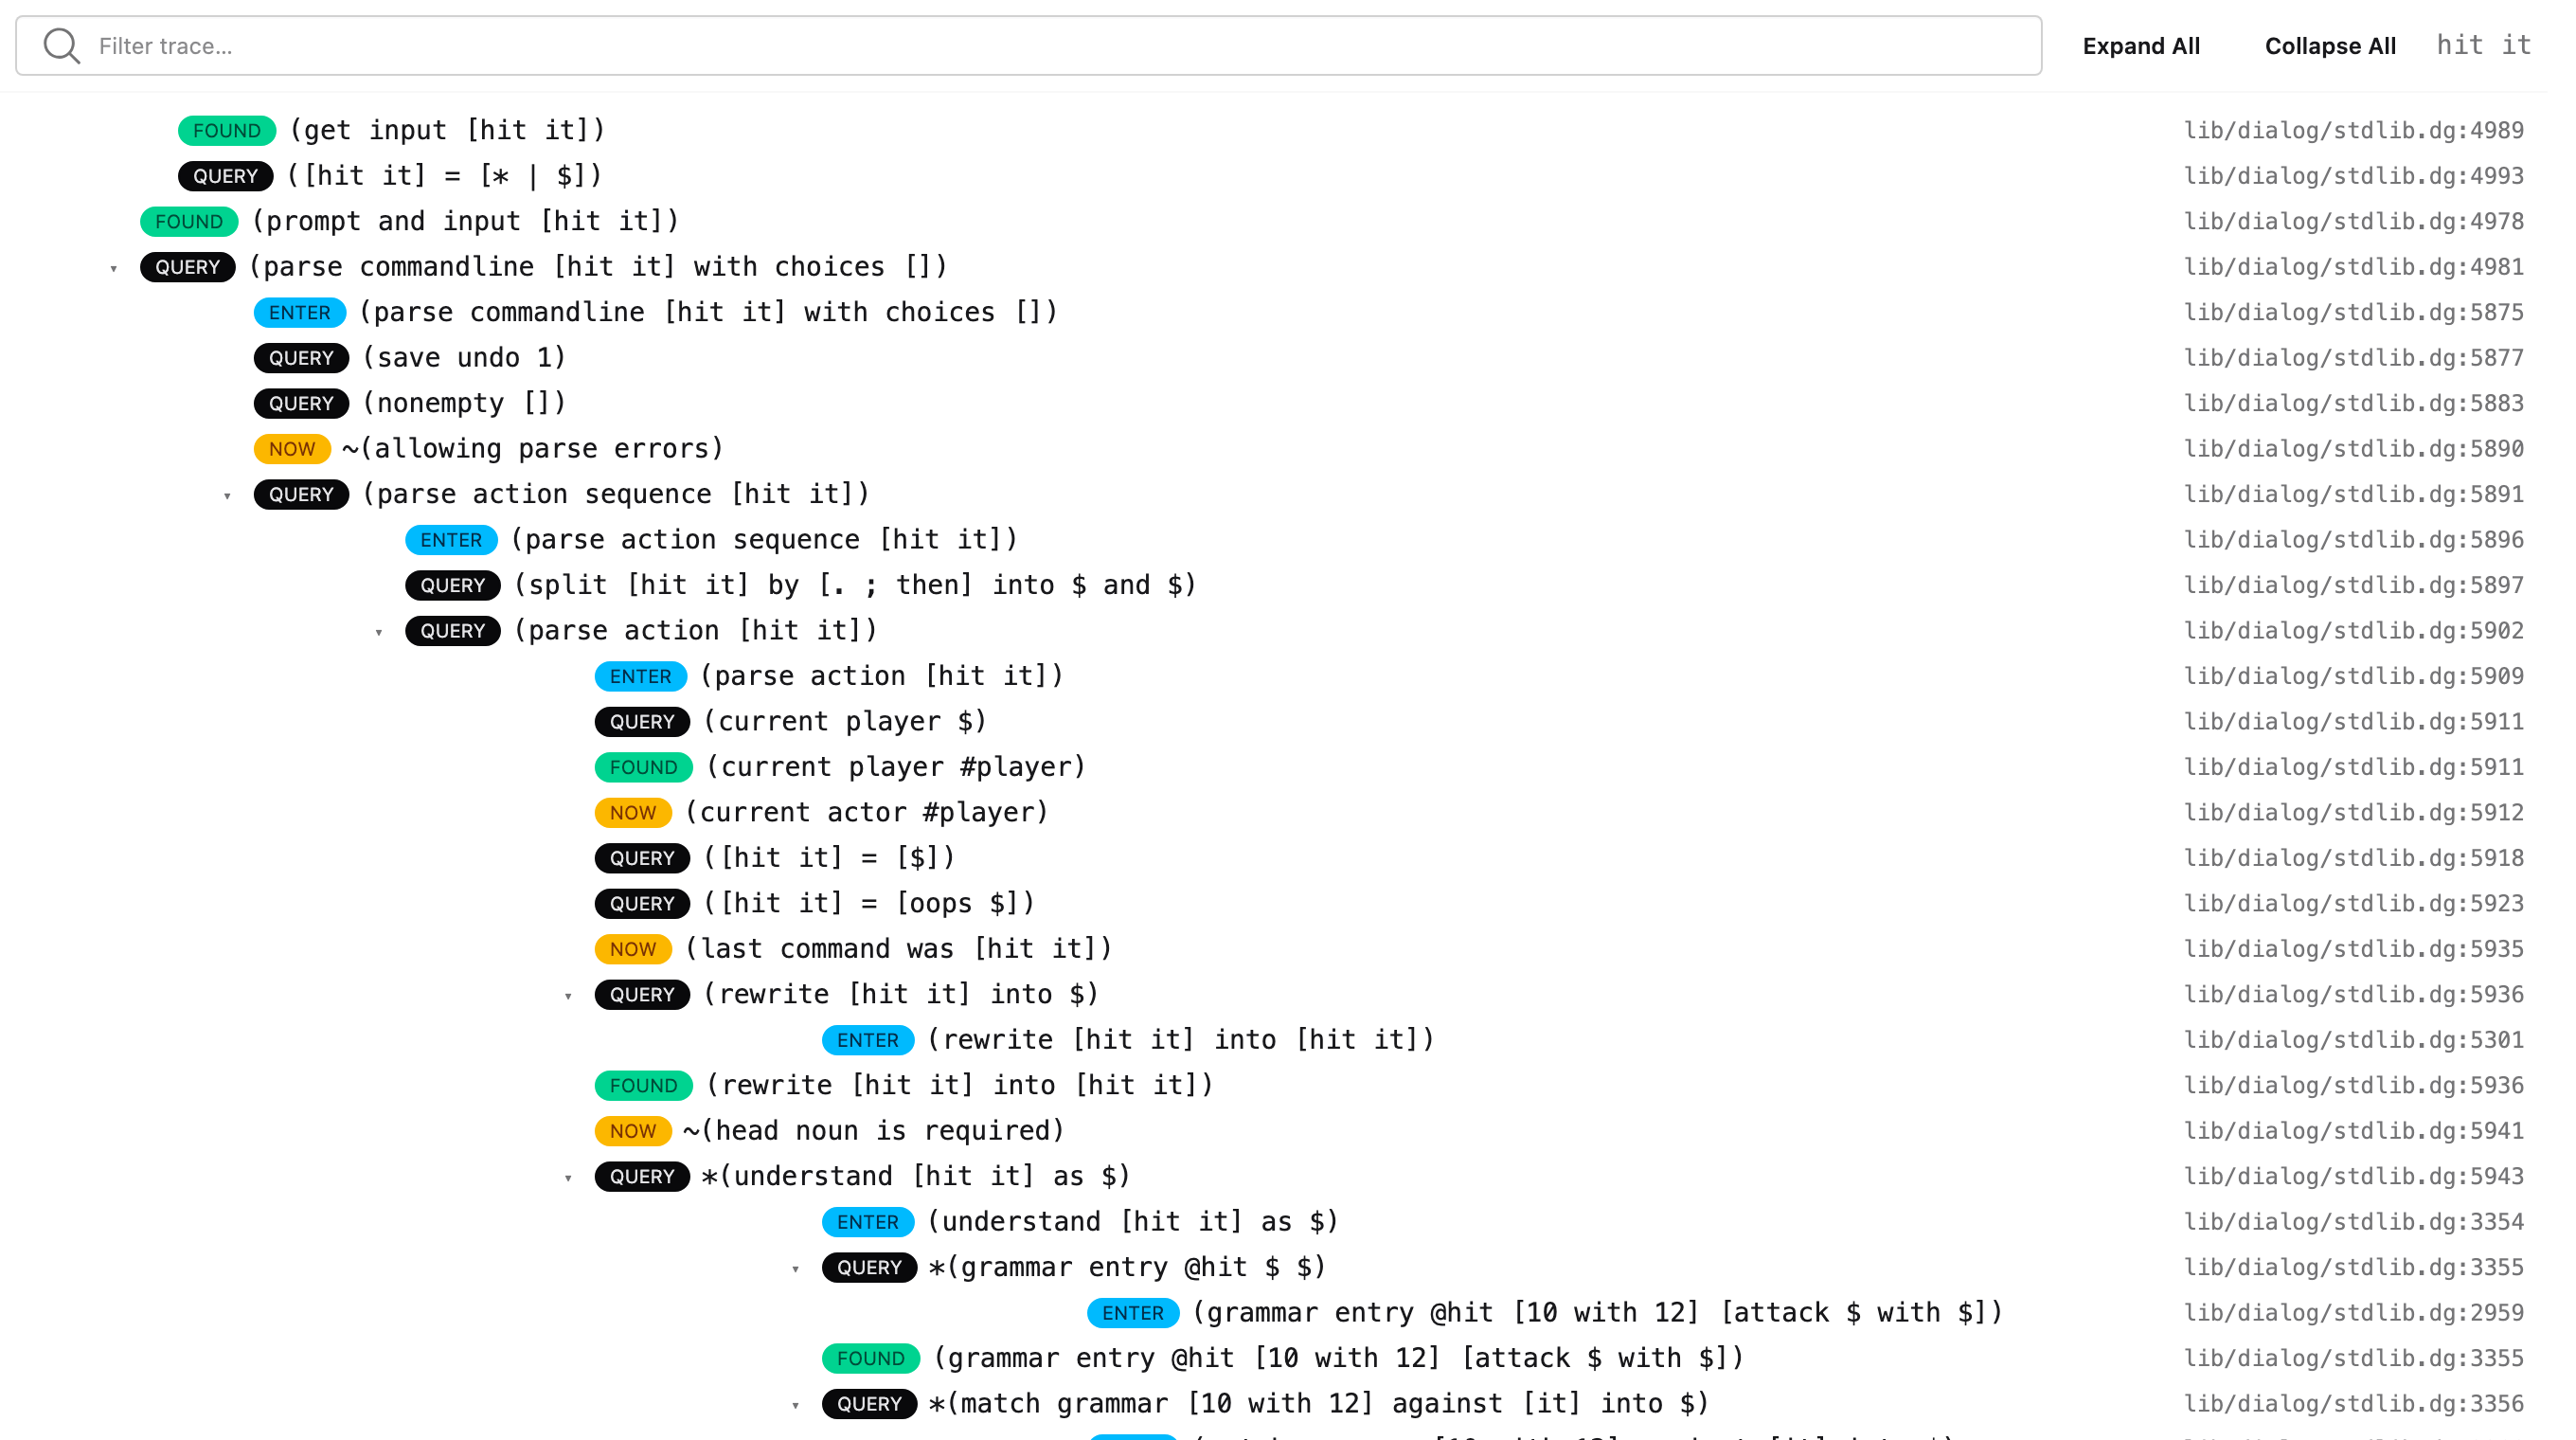
A trace is a tree of predicate calls. Each row shows an expand control (if it has children), a
type badge, the predicate expression, and the file:line where it is defined, relative to the
project root. The badges are ENTER (blue), QUERY (grey), FOUND (green), and NOW (yellow).
Expand All and Collapse All buttons sit in the panel’s header.
Filtering and jumping to source
The filter box at the top of the panel is incremental. It highlights matching rows and automatically expands their ancestors so the matches are visible; pressing Enter jumps to the next match, cycling round at the end.
Hover a row for a moment and a popover appears with a syntax-highlighted snippet of that source, following the pointer. Click a row to open the file at that line in the editor.
What’s next
When to Use More Than One Skein — when one skein is not enough.