Software
An archive containing the latest version of Dialog can be found here:
The archive contains the full source code for the Dialog compiler and
interactive debugger, as well as pre-built executable files for Linux (i386 and
x86_64) and Windows. The compiler is called dialogc, and the debugger
is called dgdebug.
Both the compiler and the interactive debugger have to be started from a commandline shell. Depending on what operating system you use, you may have to copy the executable files to a system-specific location, or simply navigate to the directory that contains them.
The Windows version of the debugger makes use of a third-party library,
Windows Glk by David Kinder. Make sure to put the two included DLL
files in the same directory as the executable file (dgdebug.exe).
To check that everything is in place, try the following two commands:
dialogc --version
dgdebug --version
Each of them should print the current version number of the Dialog software. The first two characters (a digit and a letter) identify the language version, which is currently 0m. Following that is a slash, and then the software revision number.
The archive also contains the latest version of the Dialog standard library,
stdlib.dg, and the standard debugging library extension,
stddebug.dg. You should make local copies of these files for each of your
projects, because if you ever wish to rebuild your story in the future, you’ll
want to have access to the exact version of the library you used. Also, you may
wish to make story-specific modifications to the library.
A copy of this manual is also included in the archive, and a file called
license.txt that details how you may use the software. In
short, you have the right to use, modify, and redistribute the compiler and
standard library (with or without source code), in whole or in part, as long as
attribution is given.
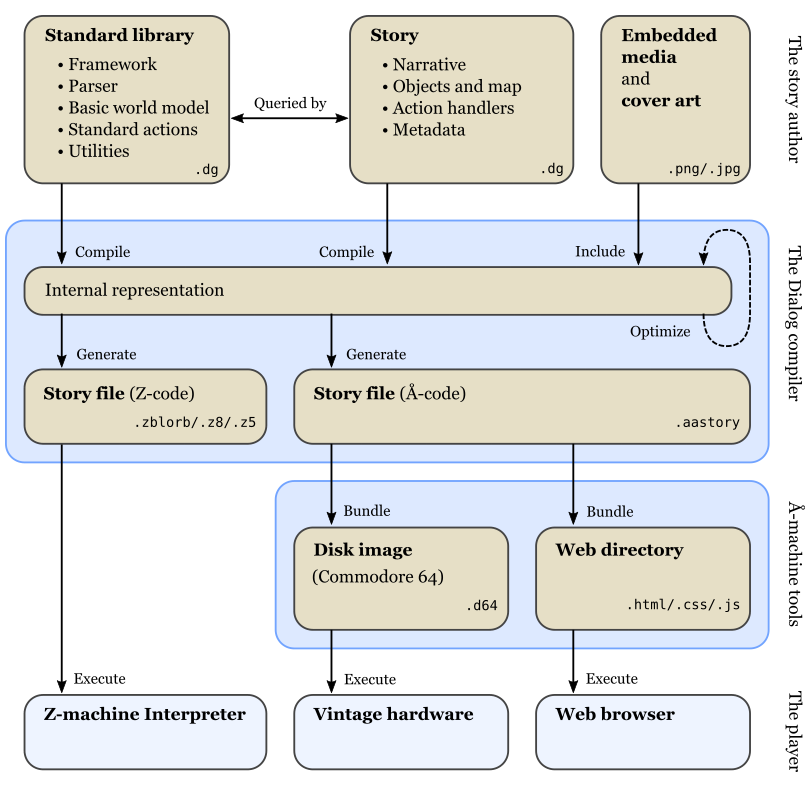
The compiler
Dialog is a compiled language. Source code is stored in text files with the
filename extension .dg. When international characters are used, they must
be encoded in UTF-8. The compiler delivers its output in .zblorb,
.z8, .z5, or .aastory format. When the zblorb format is
chosen, the compiler can optionally include cover art with the story, but this
feature is not regarded as a part of the Dialog language itself.
To compile a Dialog story into zblorb format, invoke the compiler with
the source code filenames as arguments, and optionally use -o
to specify an output filename. The default output filename is constructed from
the name of the first source code file, combined with a filename extension that
is appropriate for the current output format.
The order of source code filenames is important. The story must appear before the standard library, and any extensions (such as the standard debugging library) should appear in between. For instance:
dialogc story.dg stddebug.dg stdlib.dgThis will produce a file called story.zblorb, based on the name of the
first source code file.
Producing raw Z-code images
The example games in this manual do not declare IFIDs, which is mandatory when
the zblorb output format is used. To compile the examples, you must ask the
compiler to emit raw z8 (or z5) code by adding -t z8
(or -t z5) to the command line:
dialogc -t z8 example.dg stdlib.dg
This will produce a file called example.z8.
The examples in Part I do not make use of the standard library at all, so they are compiled like this:
dialogc -t z8 example.dg
When you use the z5 output format, the resulting file is limited to
256 KiB, compared to 512 KiB for z8. However, the z5 format is
more compact, and switching to this format can reduce the size of the story file
by about 5%.
Producing stories for the Å-machine
The Å-machine (pronounced “awe machine”) is a compact, binary story format designed to improve the performance of Dialog stories on vintage hardware beyond what is possible using the Z-machine. It also allows Dialog stories to be published on the web with support for hyperlinks and CSS styles.
To compile for the Å-machine, add -t aa to the command line:
dialogc -t aa example.dg stdlib.dgThis will produce a file called example.aastory. The .aastory file
may in turn be bundled with a javascript interpreter, or with an interpreter for
the Commodore 64, using the tool aambundle from
the Å-machine release archive.
The following command:
aambundle -o my_game example.aastorycreates a directory called my_game, and populates it with all the
necessary html, css, and js files. Simply point a web
browser to the play.html file in this directory to run the game.
To create a Commodore 64 disk image, use the following command instead:
aambundle -t c64 -o my_game example.aastoryOther compiler flags
The -v flag makes the compiler more verbose. Give it once,
and the compiler will print the wordcount for your story, as well as some
technical stats. Give it twice -vv and the compiler will
dump additional information that can be useful for debugging.
To see the full list of options supported by dialogc, type:
dialogc --helpThe interactive debugger
This section uses terminology that may be confusing if you’ve only just started to learn about Dialog. Please skim through the section anyway, because having a back-of-the-mind awareness of these techniques can be very helpful later.
We’ve seen that the role of the compiler is to convert your Dialog program into a compact, widely-supported runtime format. In contrast, the interactive debugger runs your game directly from source code, and allows you to inspect and manipulate the program while it is running.
To debug your game, launch the debugger from the commandline with your source code filenames as arguments:
dgdebug story.dg stdlib.dgThe order of the filenames is significant, just like when compiling.
The debugger also accepts a couple of commandline options. For a complete list, type:
dgdebug --helpRunning the game
At startup, the debugger analyzes your program, reporting any compilation errors. If everything looks fine, it launches the program. You can then play your game normally.
When the game is asking for input, you may instead choose to type an arbitrary query, multi-query, or now-statement. This can be used to inspect or control the running program.
The debugger remains operational after your program terminates. To start over,
type (restart). To quit the debugger, either press Control-D (Linux),
close the window (Windows), or type the special command @quit.
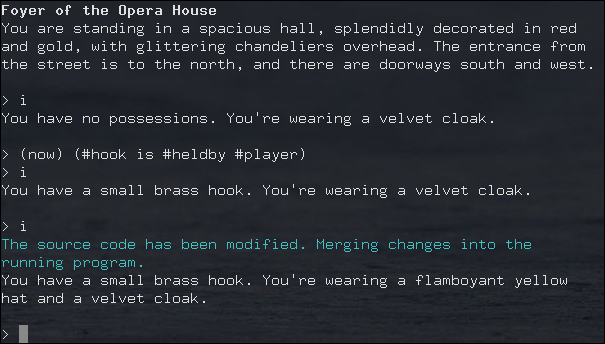
Modifying a running game
The interactive debugger watches your source code files for changes. New code is merged into the running program automatically, so you can test new functionality without restarting the game.
If there are compilation errors in the new version of the source code, the debugger will report them and put the execution on hold until you’ve fixed them.
Any dynamic predicates that have changed during gameplay retain their value, so that e.g. the player character remains in the current room, with any picked-up objects still in their inventory. But unchanged dynamic predicates will reflect the initial value declarations as they’re given in the new version of the source code.
The debugger also tries to match select statements in the old and new versions of the code, in order to make the transition as seamless as possible. But you may occasionally find that a select statement has been reset.
Be aware that by modifying the source code, you can introduce new
objects and
dictionary words,
but you can’t remove them. This
affects the operation of the built-in (object $) predicate, as well as
(get input $), with particular consequences for games that use the
removable word endings
feature. To remove extraneous objects and dictionary words, use (restart) (or @replay; see below).
Debugging commands
In addition to arbitrary queries and now-statements, the debugger allows you to
type debugging commands at the game prompt. These are recognized by a leading
@ character.
The debugger maintains a list of all accumulated input that you’ve typed into the running program. Only proper input counts, not queries or debugging commands. The list is cleared on restart, and trimmed on undo, so in that sense it represents a straight path from the beginning of the game to the current game state. The following debugging commands make use of it:
- @replay
-
Resets the game, and re-enters all accumulated input. This will normally reproduce the current game position from a clean start, but it may work differently if you’ve made changes to the source code, or if the game includes randomized behaviour. It can be useful for catching unintended non-local effects of a code change.
- @again
-
Performs an undo operation, and then re-enters the most recent line of input. This command offers more fine-grained control than
@replay, and generally works better for games with randomized behaviour. It lets you focus on the local effects of a code change. - @g
-
A synonym for
@again. - @save
-
Saves the accumulated input as a simple text file. The debugger will ask you for a filename.
- @restore
-
Resets the game, and reads input from a text file, thus recreating the saved game position. The debugger will ask you for a filename.
You can get a full list of debugging commands by typing @help at the
prompt. These commands can be abbreviated as long as the abbreviation is unique;
@h works for @help, for instance.
Suspending execution
The terminal version of the debugger (i.e. not the Windows Glk version) allows you to suspend a running computation by pressing Control-C at any time. This will immediately take you to a prompt where you can type queries and debugging commands.
To resume execution, type a blank line at this prompt.
Suspending is useful when you’ve enabled
tracing and
found that you got a bit more than you bargained for. At the
[More] prompt, simply hit Control-C, type (trace off),
and press return a second time.
It can also be used to escape from an accidental infinite loop, using
(stop). This is rarely needed, however, because the debugger does not
perform tail-call optimization, and there’s a limit on the number of recursive
calls.
Some useful debugging techniques
Use queries to inspect the state of the running program, e.g. type
*($ has parent #box) into the game to get a list of every object
that’s currently a direct child of the #box object.
Insert (log) … statements to print variables and other information
while debugging.
The standard library provides (actions on) and (actions off),
for controlling action tracing. When enabled, this feature makes the library
print the names of
actions
as it tries them.
The library also provides (scope), for listing every object that’s
currently
in scope.
The following predicates are highly useful for manipulating the state of the running game:
- (enter Room)
-
to teleport the player character to a given room,
- (now) (Object is #heldby Player)
-
to purloin an object, and
- (try Action)
-
to temporarily sidestep a parser problem, or to trace an action without also tracing the parser.
Query tracing can be enabled interactively with (trace on), and
disabled with (trace off). Tracing a complete player command will
produce a lot of output as the command is parsed. Sometimes it makes more sense
to temporarily add (trace on) and (trace off) to the source
code, surrounding the particular bit that you’re interested in. Remember, the
debugger lets you do this while the program is running.
Use the built-in predicate (breakpoint) to suspend the program from
within the source code, in order to inspect the game state at arbitrary points
during execution.
The command AGAIN (or G) lets the player repeat the
last line of input. During development, you will often want to change something
in the most recent response, and then retry the action to see what the new
version looks like. AGAIN usually works for this, but there’s a
snag: If you’ve added new dictionary words, e.g. by changing a (dict $)
rule, then a regular AGAIN will fail to pick up the new words. Use
the up-arrow to fetch the command from the input history instead. Another option
is to use the debugging command @again (or @g), which will handle
this corner-case transparently. That command also performs an implicit undo,
which is particularly useful for debugging games with timed puzzles.
Finally, a word of warning: The interactive debugger does not try to emulate the Z-machine backend, nor the Å-machine backend. The Z-machine truncates dictionary words, but the debugger doesn’t. The debugger allocates larger heap areas, but doesn’t optimize tail calls. Always test the compiled version of your game thoroughly, preferably both in a Z-code interpreter and an Å-code interpreter, before releasing it.
Building from source code
To build the Dialog compiler and debugger from source, you need a working
C compiler (such as gcc or clang) and some version of the make
command (such as gmake). Unpack the archive, enter the src
directory, and type “make”. If all went well, you should now have two
executable files called dialogc and dgdebug in the current
directory. These are the compiler and debugger, respectively.
If you are on a Unix-like system, and you wish to install the tools in a
system-wide location, type “sudo make install”.
The Windows binaries can be cross-compiled on a Linux system using the
Mingw32 toolchain.